
With the Magnificent Seven driving equity markets over the past 18 months, it’s hard to think of a time when they haven’t dominated performance. But 11 July 2024 proved an interesting day: we saw an 8% outperformance by the Russell 2000 Index, representing US small & mid-cap stocks, versus those seven tech giants1.
With large-cap, tech-focused names having run the show for so long, did this summer data outlier mark a turning point for small and mid-caps (SMIDs)?
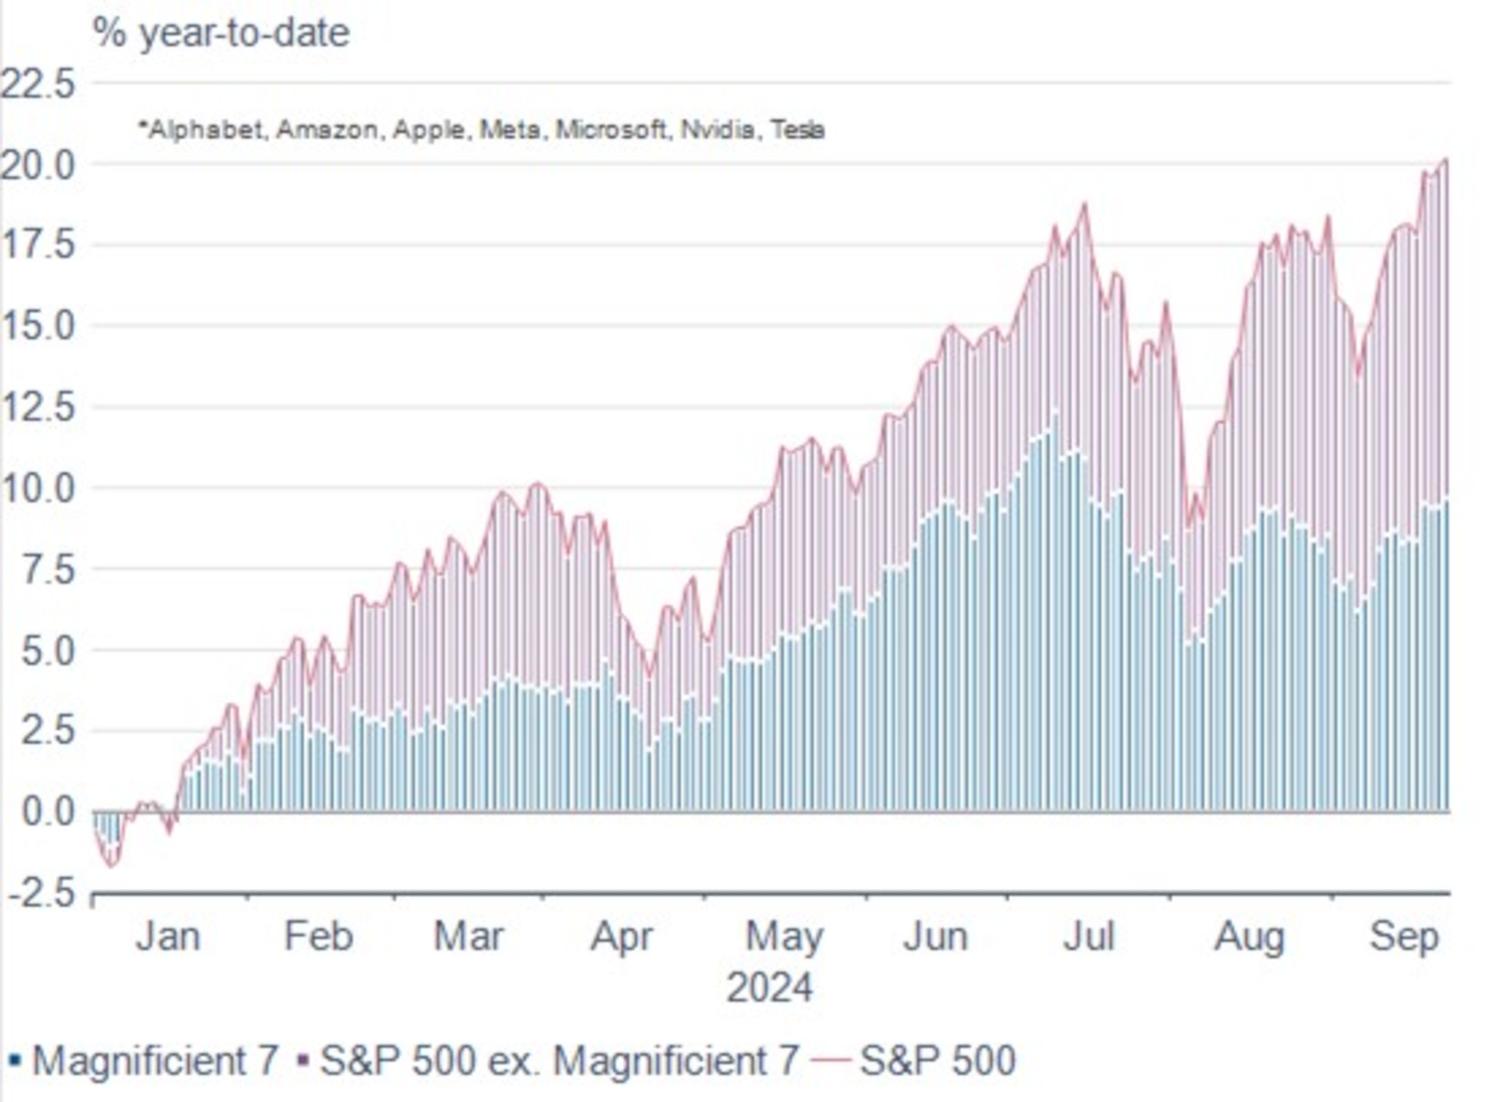
We think it highlighted the start of shift in the macro landscape that should enable SMID stocks to deliver a valuation catch up and notably outperform their large-cap peers over the long term.
July’s performance gap came about because of dynamics in the interest rate environment, with positive CPI numbers taking the probability of a Federal Reserve (Fed) rate cut in September up to 90.3%2.
That optimism proved to be well placed with the cut coming to fruition on 18 September in the form of a jumbo 50bps reduction. This fuelled a surge in optimism regarding the economic outlook and the probability of the US moving from ‘soft landing’ towards ‘early cycle recovery’. In the recovery phase, we would expect to see further rate reductions, economic activity to pick-up and inflation to remain at or below target.
For SMID stocks, this is all good news. SMIDs are most exposed to falling interest rates as they tend to have higher debt levels compared to large caps. This debt is often structured using floating rates, so cuts bring rapid borrowing-cost relief.
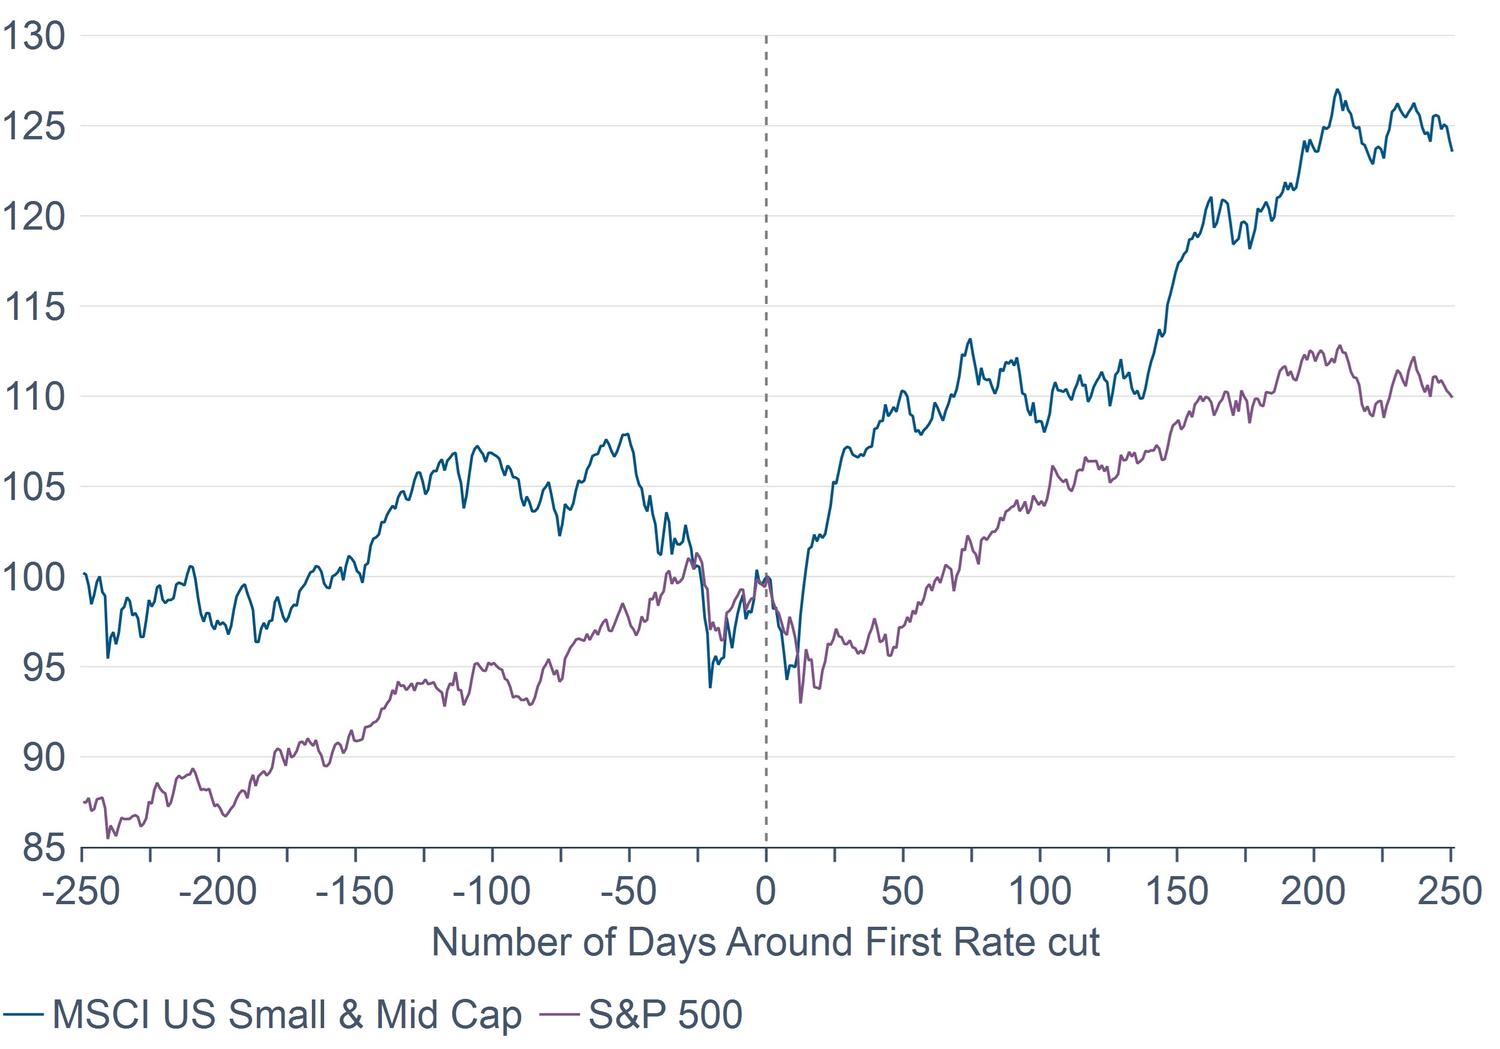
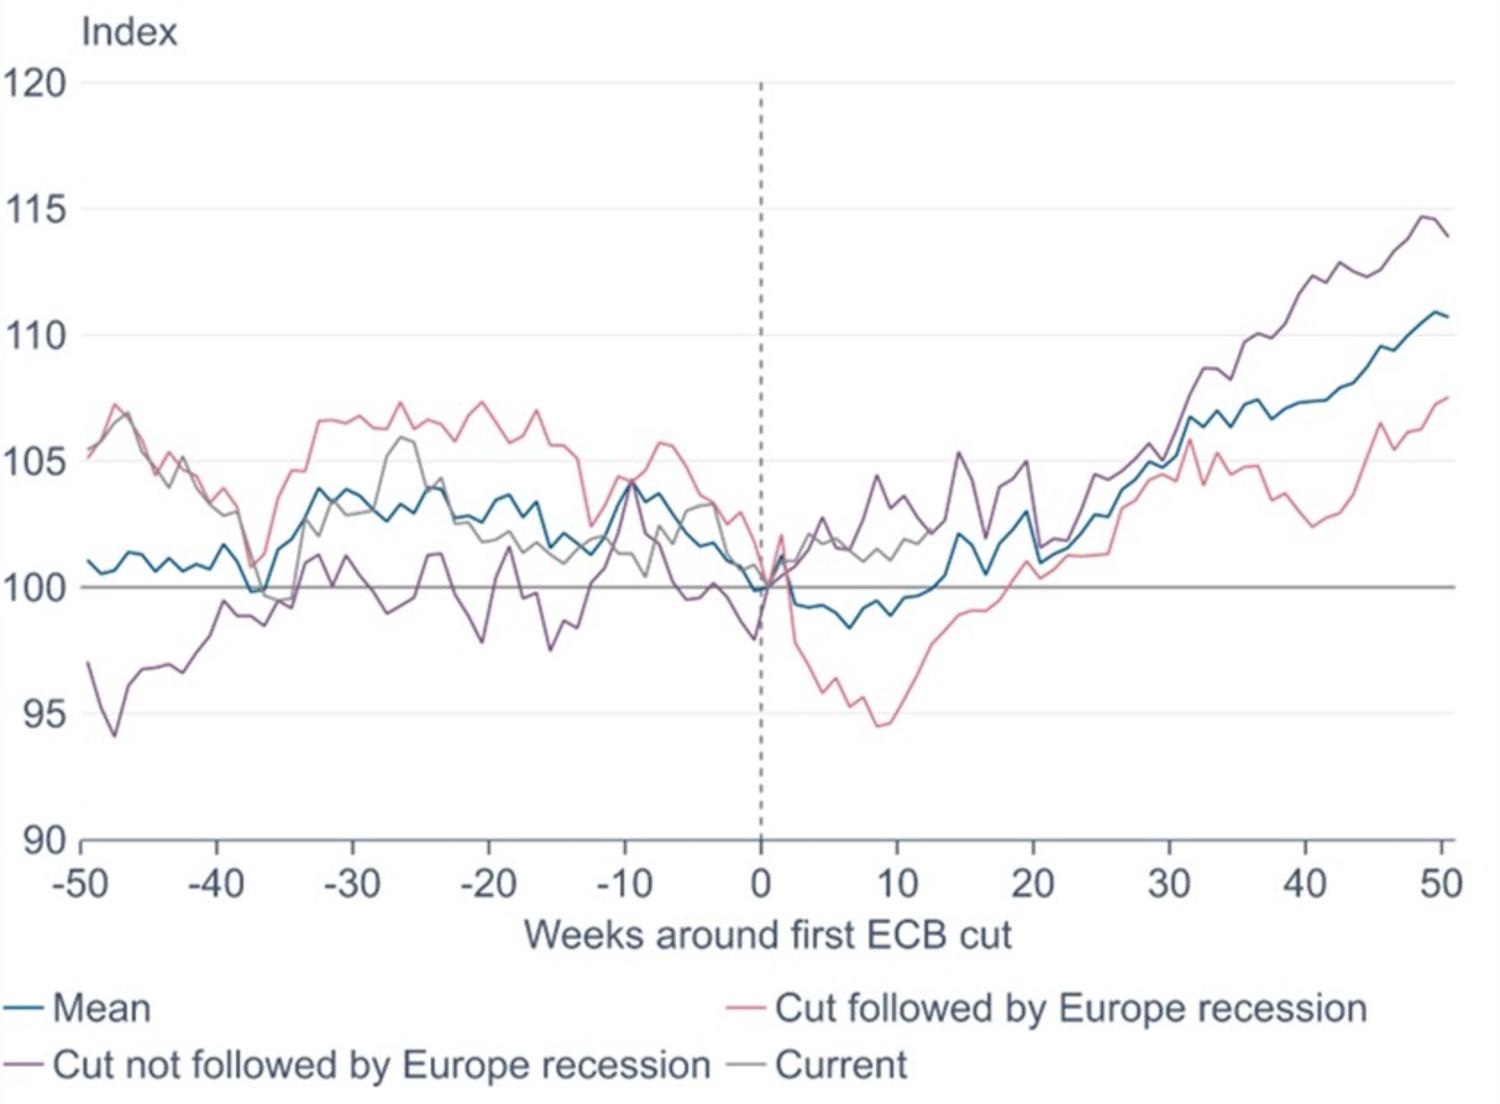
Historic data suggests that, following a rate cut, we could expect to see US SMIDs outperform large caps for 250 days, providing there is no subsequent recession (chart 2a). While in Europe, SMIDs have outperformed following the first European Central Bank (ECB) rate cut whether or not a recession follows (chart 2b).
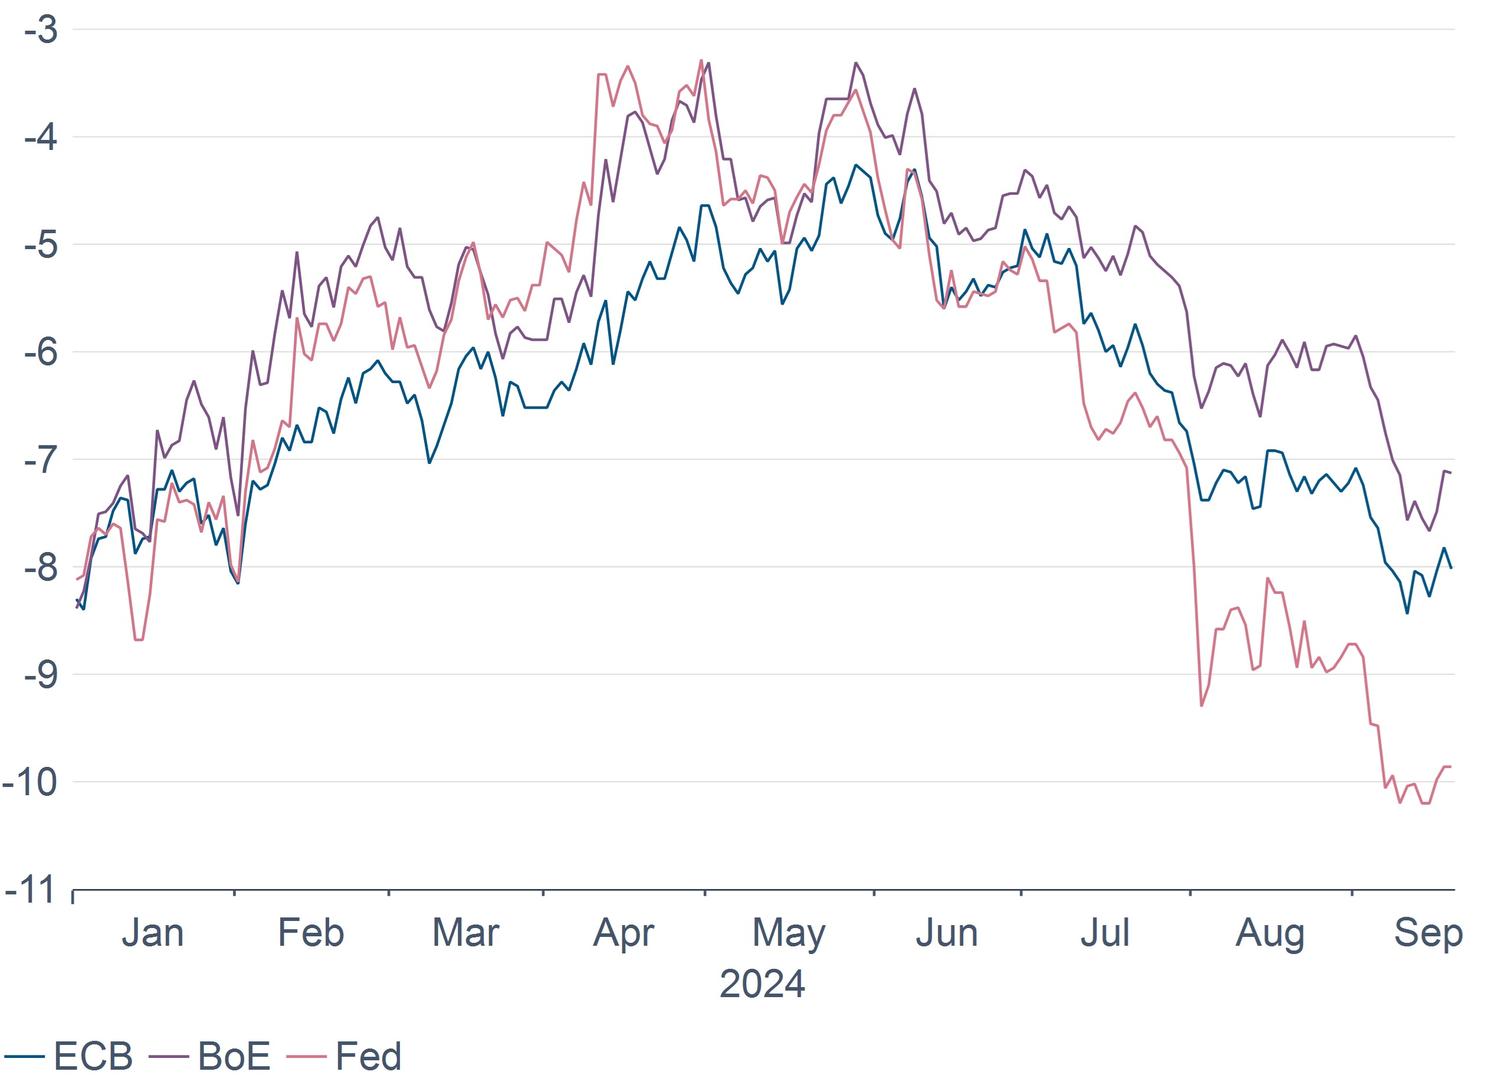
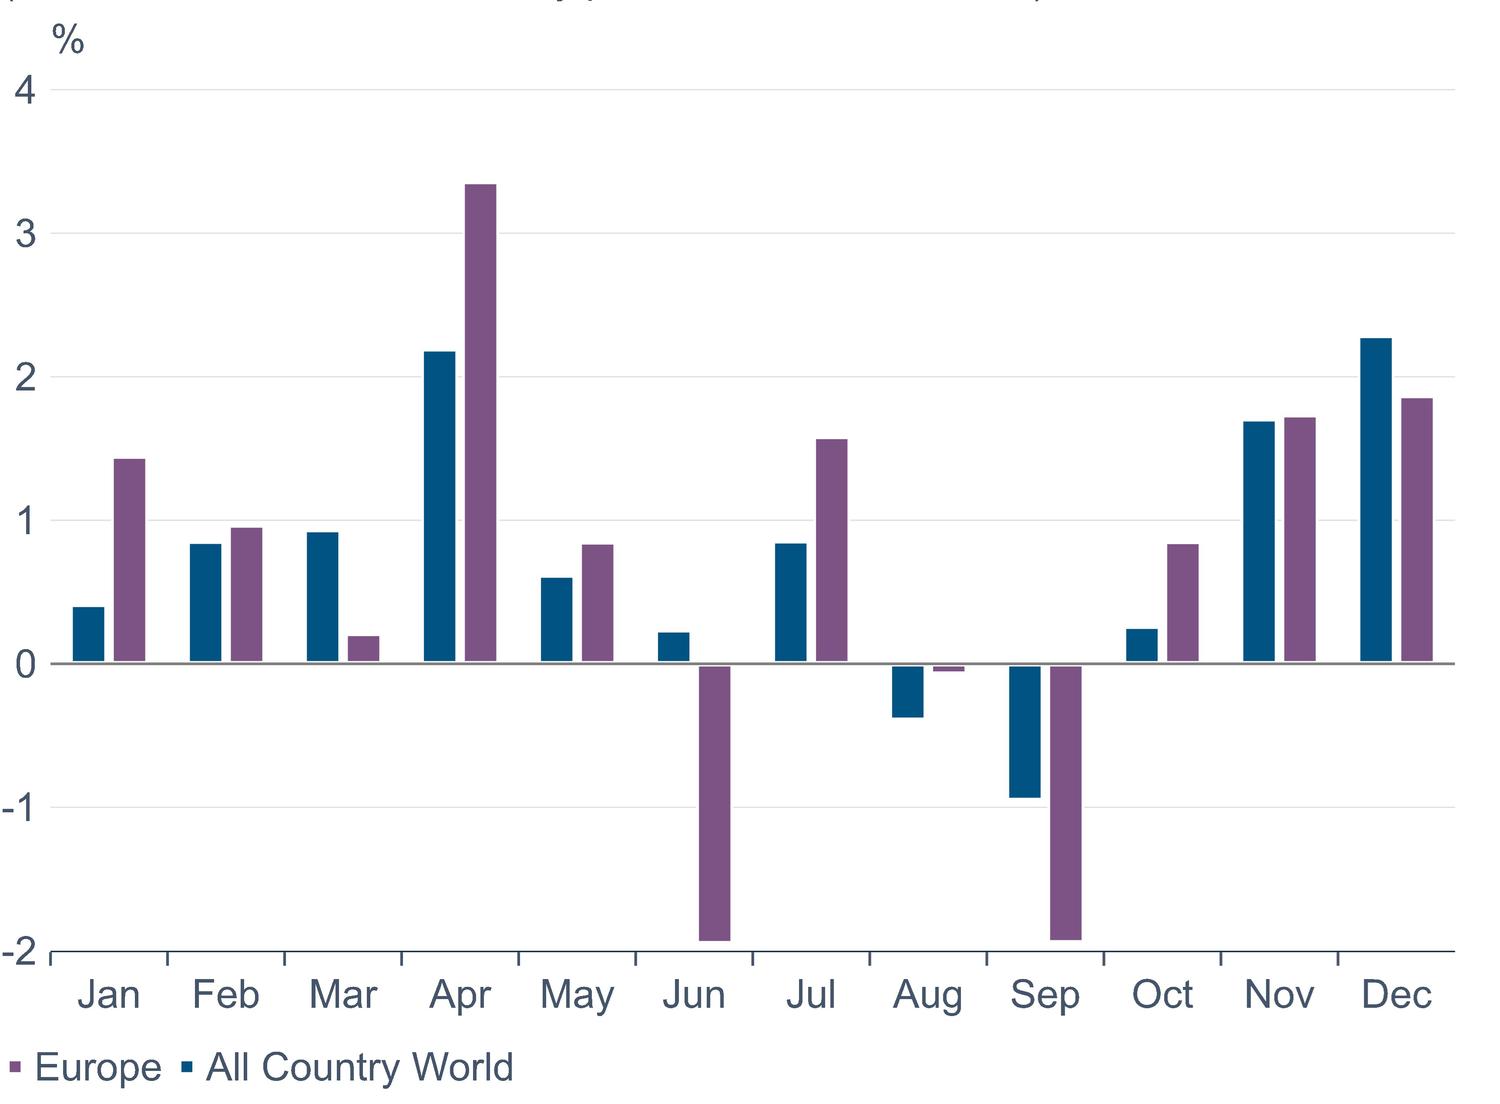
On top of this, the market is currently pricing in a further eight 25 bps cuts by the end of December 2025 (chart 3), further strengthening the outlook for SMID performance, especially as we enter the fourth quarter, which has historically demonstrated positive seasonality for small caps (chart 4).
While the shift in economic trajectory hinges on US macro, it’s not only US names that are set to benefit. The US rates trajectory sets the tone for global market performance, so we would expect SMIDs across the US, Europe and Switzerland, which typically have large exposures to global activity, to outperform large caps.
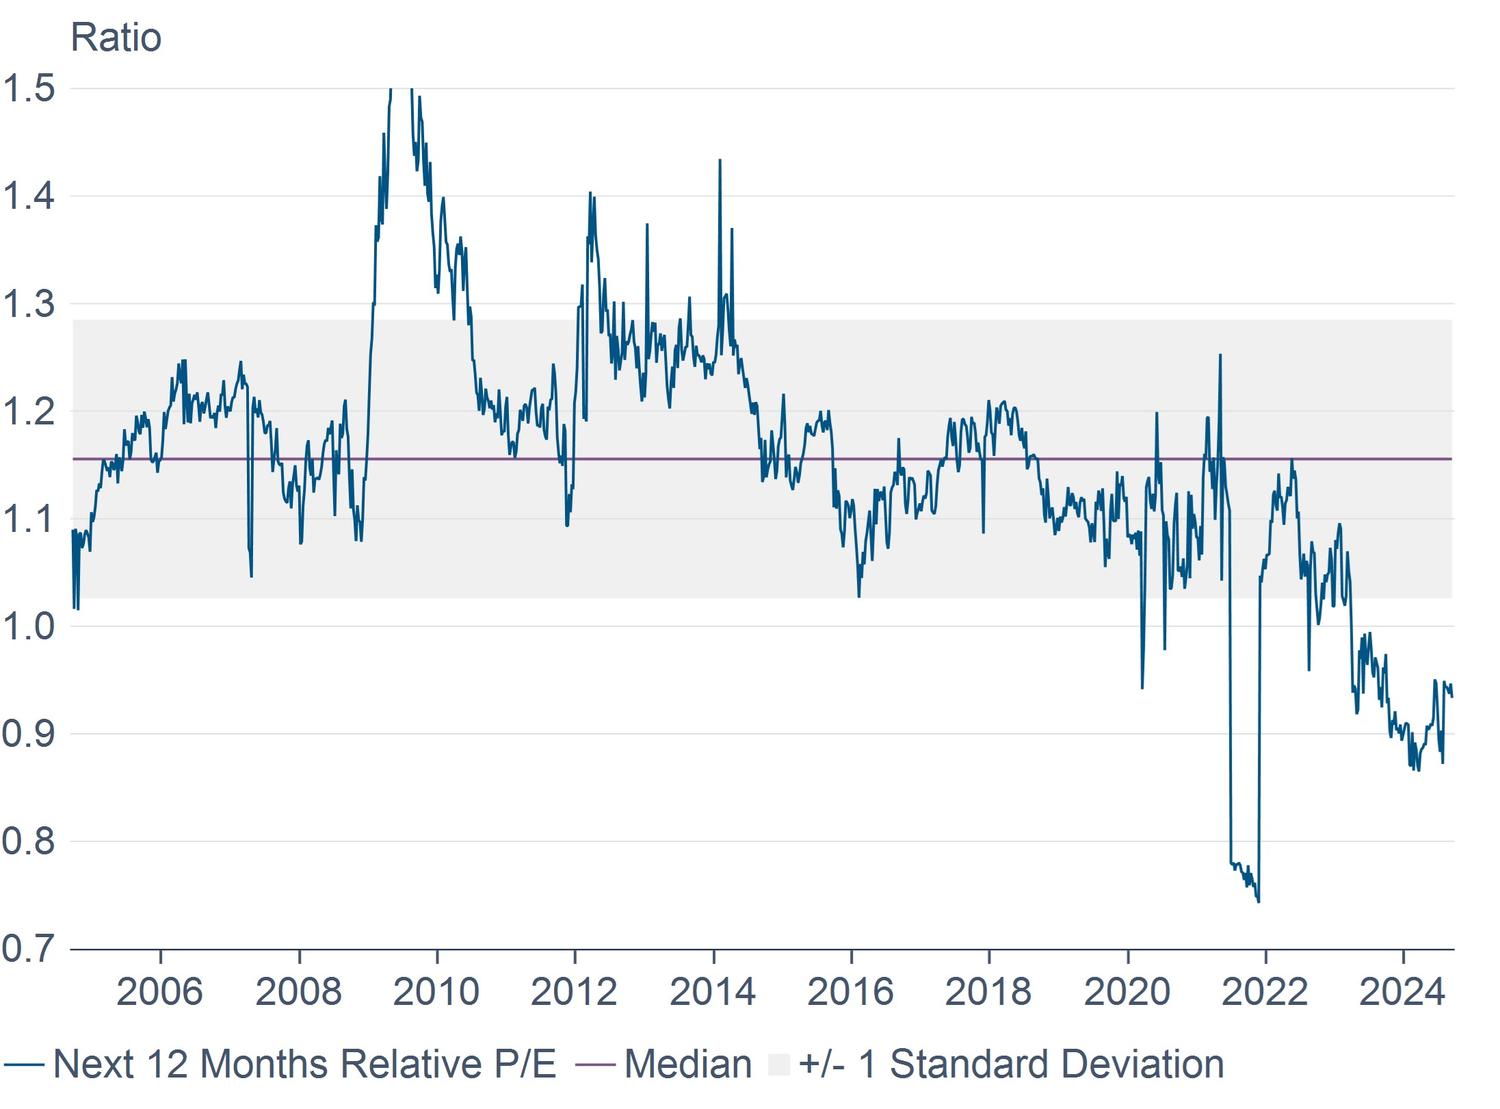
In Europe, SMIDs are currently trading at a c.20% discount relative to large caps. In terms of value creation, this is the most attractive differential seen in the past 20 years (chart 5). The numbers are similar in the US.
In terms of sectors, technology has proven itself king of the large and mega-cap names. The subsequent performance concentration in large-cap indices to just a handful of leading names has left investors exposed. If a correction comes, it could be very painful.
Conversely, with its strong underweight to IT, the SMID market offers diversification away from tech and towards companies with more attractive valuations, notably in industrials, financials and healthcare, where the SMID market is overweight3.
SMIDs have also already gone through a round of earnings revisions this year – small-caps have come off 11% year-todate and 14% over 12 months, and mid-caps 2% and 4% respectively. In contrast, earnings revisions on the S&P 500 Index are 0% year-to-date and -1% over 12 months4.
So, while US economic activity has been slowing since the start of the year, we haven’t yet seen any downward revisions in earnings for large caps. Whereas SMIDs have already priced in some slowdown, with lower earnings expectations.
With the fundamentals stacking up for SMID, the question becomes how to allocate. A tactical position is a first thought to benefit from the diversification angle, alongside better valuations. But taking a longer-term view, fundamental indicators suggest SMID stocks offer the potential to deliver an annual excess return of 1 percentage point over large caps in Europe and the US, making them an interesting core consideration.
Assuming macro projections come to fruition, we see positive performance potential extending out up to 10 years.
1 Bloomberg
2 CME Group
3 Referencing US Russell 2000 Index vs S&P500 Index in the US, and Stoxx Europe Small 200 and Mid 200 Indices vs. Stoxx Europe 600 Index in Europe
4 Morgan Stanley, as at 24 September 2024
European Equities
Swiss Equities
Convertible Bonds
Continue to
