
Investors often debate what is the best indicator to look at for appreciating the attractiveness of convertibles from a yield standpoint.
A bond's price is a crucial factor in yield estimates. Yet, the price of a convertible bond (CB) considers the value of both the bond component and the equity call option. Additionally, the embedded call option has the potential to significantly increase the price of the CB above par. This yields an apparent negative yield to maturity without taking the option value into account.
This is why negative yields to maturity on convertibles are not particularly useful, in our view. These straightforward calculations overlook the fact that holders of such issues will convert into underlying shares at expiration that are worth a lot more than par.
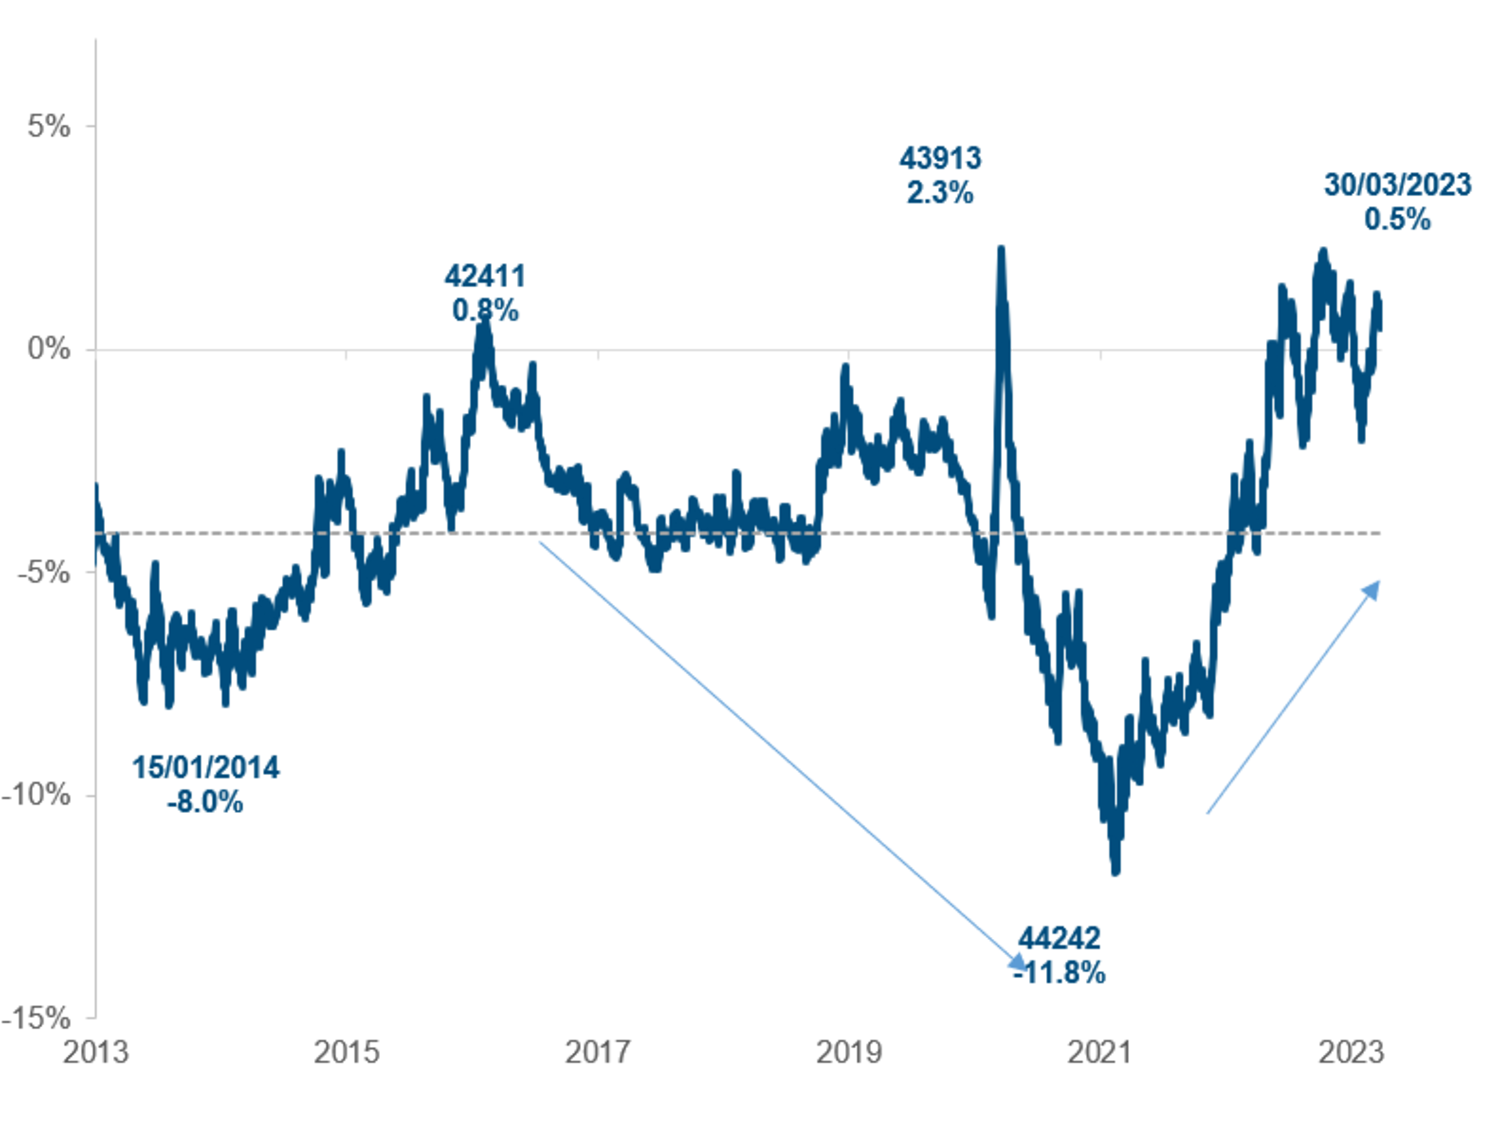
Chart 1: Yield to put/maturity of the Refinitiv Global Index
Source: Refinitiv, 30 March 2023
As illustrated in chart 1, the average yield to maturity/put hit a record negative level of -11.8% when the Refinitiv Global Convertible Bonds Index reached its peak performance on 15 February 2021. That is why, in our view, investors in convertible securities should only use it to understand the minimum return that may be anticipated if the stock is below the conversion price and the bond does not default.
Instead, we see the current yield – which is the annualised interest coupon rate expressed as a percentage of a bond's market price – as a better reflection of the actual cash flows from the convertible, which are frequently a key investment decision factor. For example, if a bond pays a 2% coupon and can be purchased for 105%, the investor will effectively earn a 1.90% current yield.
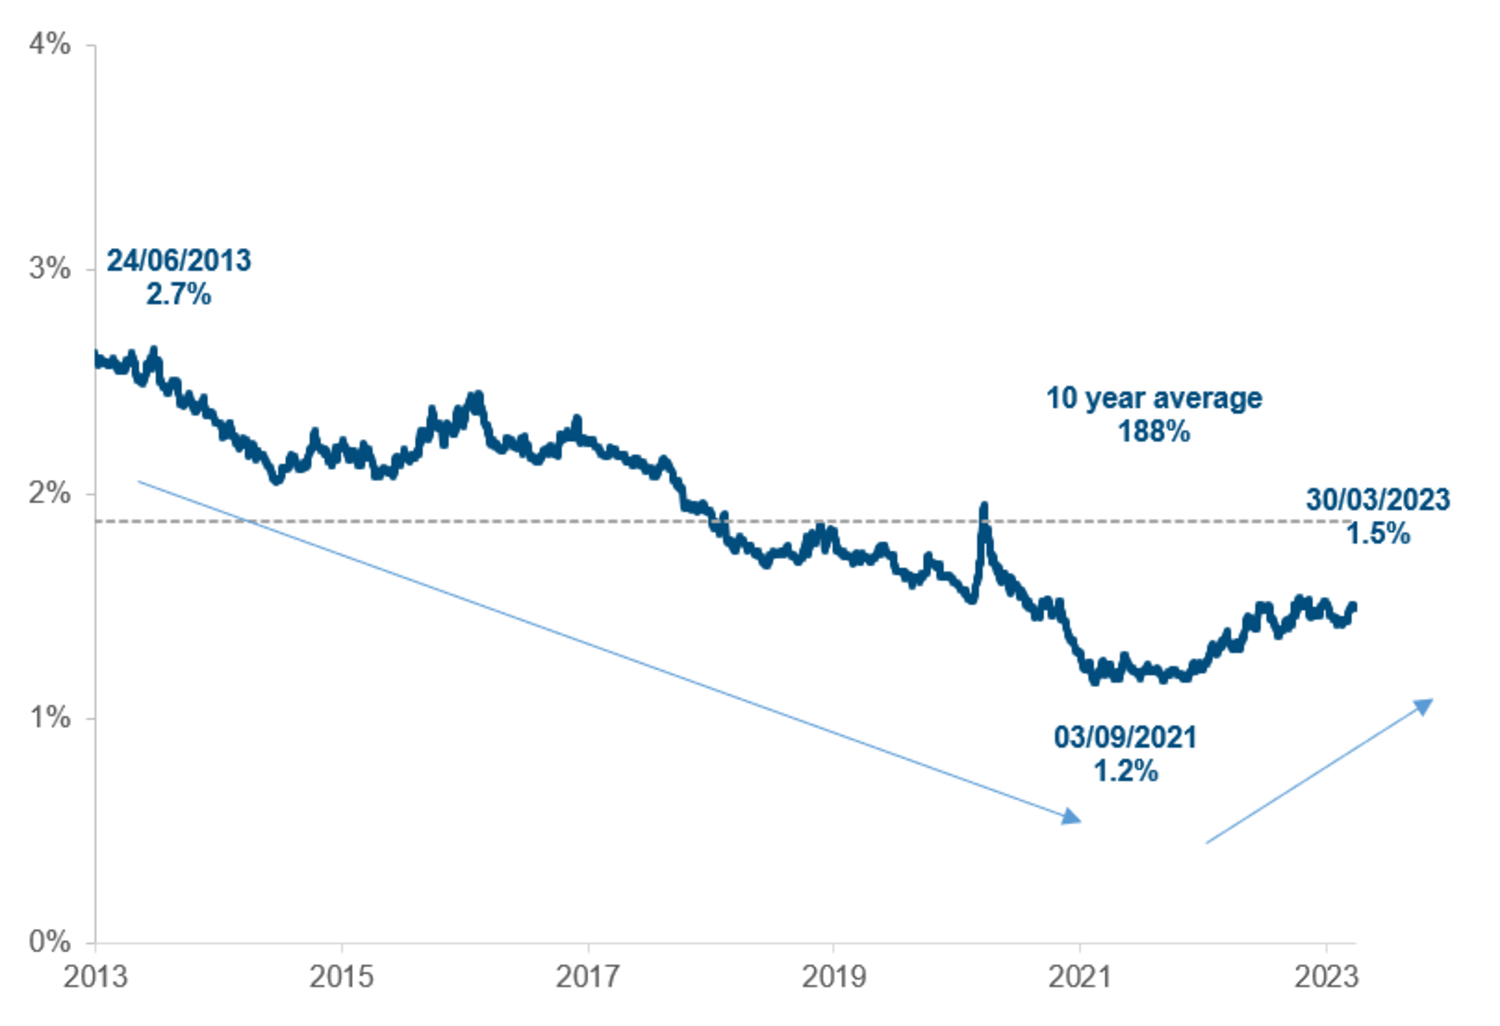
Chart 2: Current yield of the Refinitiv Global Index
Source: Refinitiv, Mirabaud Asset Management, 30 March 2023
As shown in figure 2, the average current yield of global CBs declined steadily from more than 2.7% in 2013 to less than 1.2% in 2021 but has started to reverse back to 1.5% with the help of recent new issues that came with higher coupons.
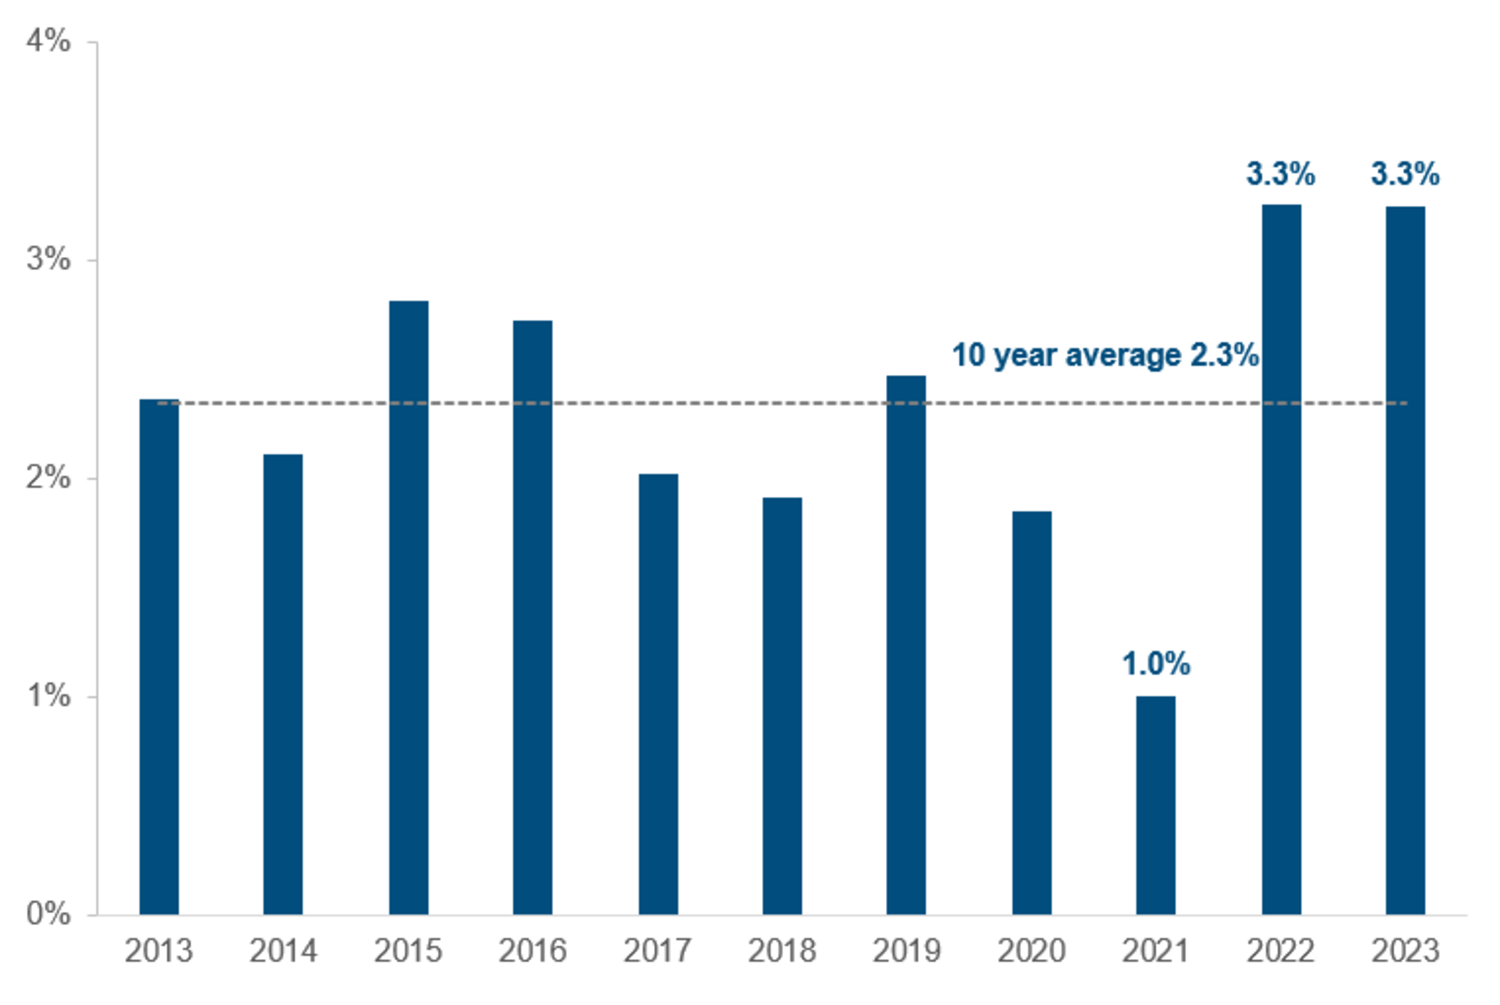
Chart 3: Coupon of new issuance
Source: Bank of America, Mirabaud Asset Management, 30 March 2023
As illustrated in chart 3, the average global CB new deal coupon totalled 3.3% both in 1Q23 and last year versus 2021’s low of 1%. The 10-year average is 2.3%. The rate increase and expectations that rates will stay high over the medium-to-longer term are major drivers of conversion issuance, supported by traditional issuers (investment grade, large caps, defensive sectors) in search of cost savings.
To sum up, the asset class currently benefits from higher coupons from stronger issuers because the addition of yield earned (whether the underlying stock goes up or down) strengthens convertible asymmetry. The primary market is also an important source of balanced CBs.
With this promising outlook, we believe the asset class is likely to draw new investment for diversification purposes from both credit and equity investors looking to acquire risk-controlled exposure to equities, frequently in names not present in the credit universe.

Continue to
